1 Small Area Estimations for the poverty mapping: an overview
As discussed with Nobuo, Danielle and Eduard, place for an practitioners overview chapter.
Some overview ideas:
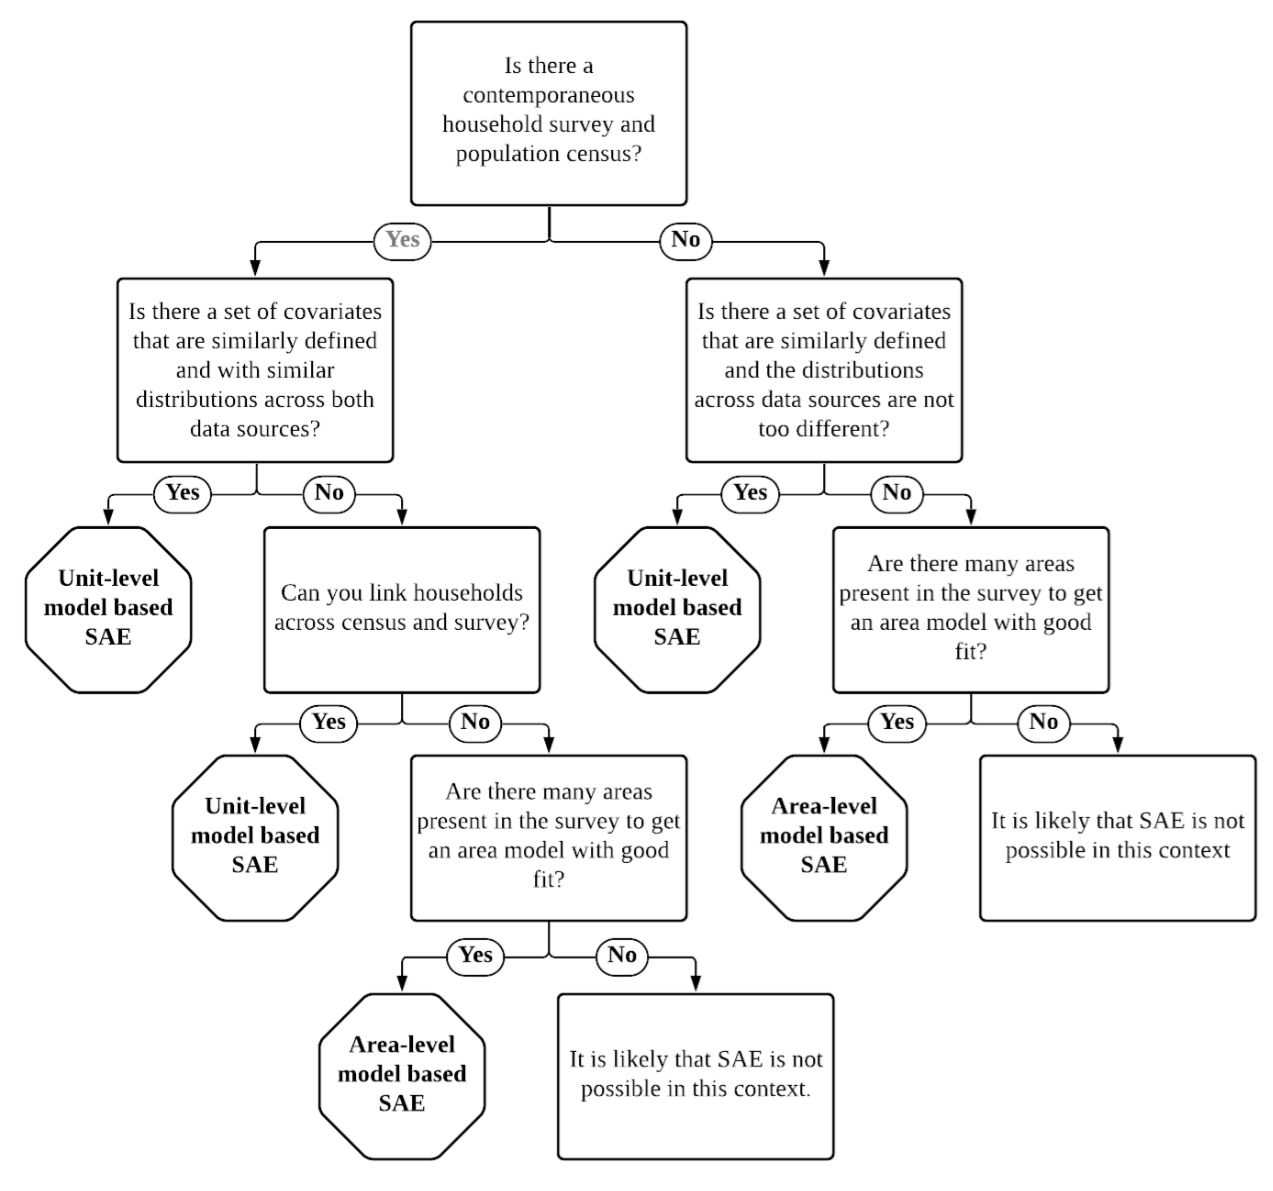
Make a decision tree of methodology given data availability.
Make a table to take a stock of methods and Corresponding R funciton/packages that implement it. For example, see Table 1.1
| Methods | sae |
emdi |
SUMMER |
|---|---|---|---|
| Spatial Fay-Herriot | sae::mseFH() |
SUMMER::smoothArea() |
|
| FH Miltivariate | |||
| Autocorrelation |
Place figures under images and use them in the text as follows making sure to refer the sources correctly. For example, Figure 1.1 is adapted from (Corral et al. 2022, 5).
One can also embed mathematical formulas following the latex syntax: \(y=a + b \log x\) . For more information, see quarto help on authoring.